
Beautiful charts in Swift
Piotr Sochalewski

Charts are a lovely way to present complicated data sets. Everything seems to be easier when you present it in on a chart. One picture is worth of thousand words and the same can be said about charts.
Unfortunately charts libraries are often not-so-easy or (and that’s the worst) after multiple hours spent with it you see that’s something is impossible with that one. Probably one of the most popular is CorePlot. For me that was an overkill. I believe you can make beautiful chart with it, but it takes hours or even days. On the other hand, iOS-Charts gives beautiful charts without spending whole week on it. Out of the box your charts seem to be cool. In addition it has so many properties letting you configure a chart the way you want – it’s really powerful. Also it’s written in modern Swift.
Furthermore it can be considered as a port of great MPAndroidChart, meaning that you can easily achieve the same effect on Android OS too. That makes iOS-Charts the best choice.
Before you take iOS-Charts for a spin, let’s see how to use it. In fact iOS-Charts has only one big disadvantage – it’s not well documented. But thanks to the fact it’s really similar to Android library, MPAndroidChart Wiki is really helpful.
First, create a new iOS project. Remember to not name the project ‘Charts’, because that would make conflict with module names. I named my ‘ChartsDemo’. Choose Swift as programming language and add pod 'Charts' to your Podfile.
Two things. First, if you don’t know much about CocoaPods or even about creating projects, you can find more info in one of our previous tutorials, like this one. Second, you may think it’s weird that pod named Charts is connected with library named iOS-Charts. As far as I know with the next release of the library it’s going to be changed and repository’s name would be the same as pod’s name. Woohoo!
Your Podfile should look like the one below.
| 1 2 3 4 5 6 | platform :ios, '8.0' use_frameworks! target 'ChartsDemo' do pod 'Charts' end |
Okay, you’ve got empty project with installed pod. Let’s start then.
Charts lets you make line, bar, pie, scatter, bubble and radar charts. Everything you want. But before we start, we need some data that can be presented on a chart. If you don’t have any, I’ve prepared data generator that I use in this tutorial.
| 1 2 3 4 5 6 7 8 9 10 11 12 13 14 15 16 17 18 19 20 21 22 23 24 25 | import Foundation struct Sale { var month: String var value: Double } class DataGenerator { static var randomizedSale: Double { return Double(arc4random_uniform(10000) + 1) / 10 } static func data() -> [Sale] { let months = ["Jan", "Feb", "Mar", "Apr", "May", "Jun", "Jul", "Aug", "Sep", "Oct", "Nov", "Dec"] var sales = [Sale]() for month in months { let sale = Sale(month: month, value: randomizedSale) sales.append(sale) } return sales } } |
This code is self-explanatory. Class func data gives sample i.e. sales data with profit for each month. That’s a perfect fit for bar or line chart, so let’s do those!
Open storyboard and add in the first view controller new UIView. In Identity Inspector change its class to BarChartView (class names are really simple and if you want a line chart then a proper class is named just LineChartView), and then pin the view with margin equals zero to all edges of the superview.

We need an outlet to this new view, so make one ctrl-dragging this to ViewController.swift. I named mine just barChart. Your Xcode should notice really fast that BarChartView class is a one big mystery for it. Just add import Charts at the top of your file. You view controller’s class can look like this:
| 1 2 3 4 5 6 7 8 9 10 11 | import UIKit import Charts class ViewController: UIViewController { @IBOutlet weak var barChart: BarChartView! override func viewDidLoad() { super.viewDidLoad() } } |
Now we should give the chart some data to present. I do all the steps in viewDidLoad like so:
| 1 2 3 4 5 6 7 8 9 10 11 12 13 14 15 16 17 18 19 20 21 22 23 24 25 26 27 28 29 30 31 32 33 | override func viewDidLoad() { super.viewDidLoad() // Get and prepare the data let sales = DataGenerator.data() // Initialize an array to store chart data entries (values; y axis) var salesEntries = [ChartDataEntry]() // Initialize an array to store months (labels; x axis) var salesMonths = [String]() var i = 0 for sale in sales { // Create single chart data entry and append it to the array let saleEntry = BarChartDataEntry(value: sale.value, xIndex: i) salesEntries.append(saleEntry) // Append the month to the array salesMonths.append(sale.month) i += 1 } // Create bar chart data set containing salesEntries let chartDataSet = BarChartDataSet(yVals: salesEntries, label: "Profit") // Create bar chart data with data set and array with values for x axis let chartData = BarChartData(xVals: salesMonths, dataSets: [chartDataSet]) // Set bar chart data to previously created data barChart.data = chartData } |
It should work now. In my case after running the app it looked like this:
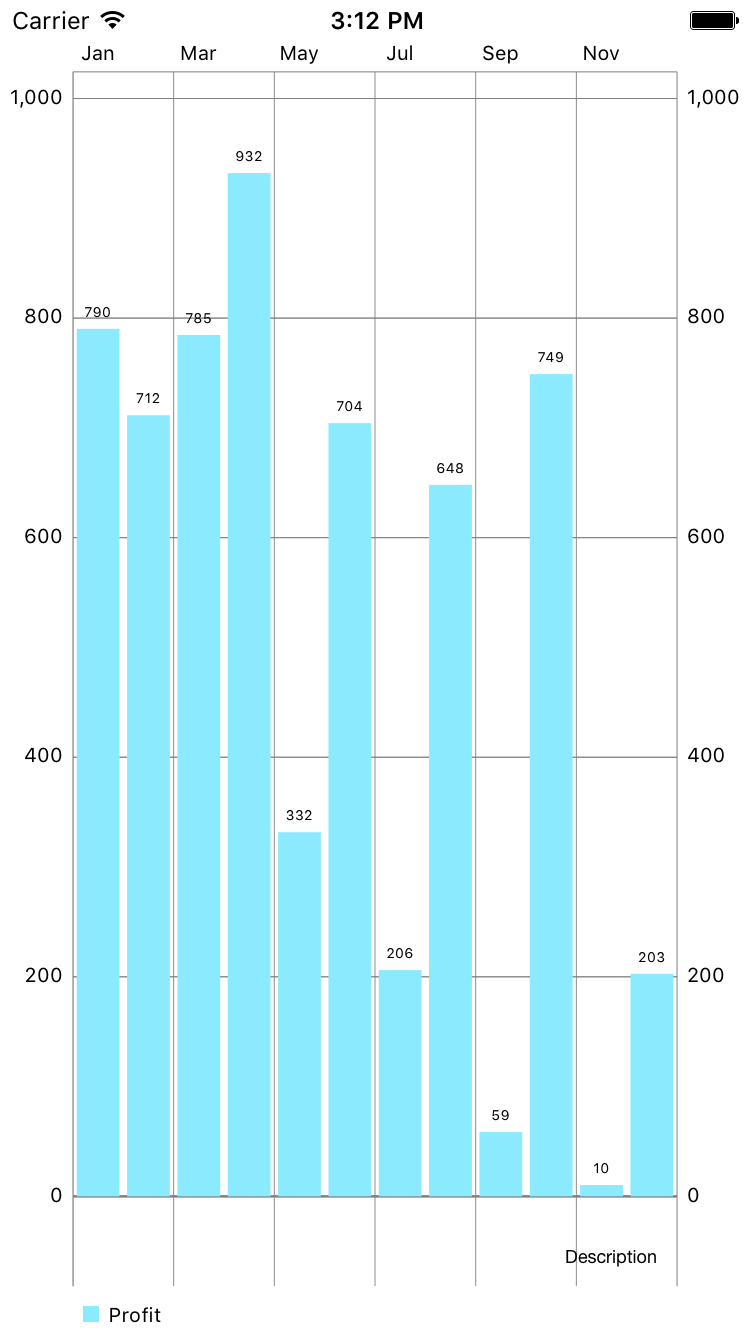
Not bad for first attempt, but a little boring. Let’s polish it right now.
There’re multiple things that we can easily fix. First, we don’t need ‘Description’ in the right bottom corner. To remove it we need just this:
| 1 | barChart.descriptionText = "" |
Unfortunately although Charts is written in Swift, it doesn’t use all available semantic. descriptionText is not an optional, so it can’t be niled. But an empty string does the job.
Second, there is no legend and/or values with month’s names. How would I know that these 12 bars are representing one year instead of twelve years or days? We have to add some labels. It’s simple and requires exactly one line of code:
| 1 | barChart.xAxis.labelPosition = .Bottom |
But if you run the app right now you can notice that only every second label is shown. That’s because Charts have an algorithm that detect how many labels can be shown to make them readable. Take a shot and show every single legend element this way:
| 1 | barChart.xAxis.setLabelsToSkip(0) |
Next thing, we precisely know min and max values that can be received from DataGenerator. Why not add them to the setup to make the chart scaling more accurate?
| 1 2 | barChart.leftAxis.axisMinValue = 0.0 barChart.leftAxis.axisMaxValue = 1000.0 |
The bars are definitely not happy or even colorful. Why not paint them with some bright colors?
Probably you have noticed that single chart can present multiple chart data sets (that’s exactly why I showed you BarChartData initializer with dataSets instead of also available dataSet parameter). That’s why we can color each data set separately. We can give an array of colors or use one of predefined colors from ChartColorTemplates enum.
| 1 2 3 4 5 | chartDataSet.colors = [.redColor(), .yellowColor(), .greenColor()] // Or this way. There are also available .liberty, // .pastel, .colorful and .vordiplom color sets. chartDataSet.colors = ChartColorTemplates.joyful() |
As I said we’ve got only one chart data set, so there is no need for the legend at the bottom. Again it’s just one line of code:
| 1 | barChart.legend.enabled = false |
Out of the box, iOS-Charts lets you pinch-to-zoom on a graph. If you want to disable it, then of course it’s possible. It can be enabled separately for each axis, but the code below disables both of them including double tap to zoom.
| 1 2 3 4 | barChart.scaleYEnabled = false barChart.scaleXEnabled = false barChart.pinchZoomEnabled = false barChart.doubleTapToZoomEnabled = false |
Another nice option is choosing bars by tapping them. Then you can show some kind of balloon with value or description. We don’t need that in our case, so selection can be disabled.
| 1 | barChart.highlighter = nil |
It looks like right axis is unnecessary here. The chart is really simple and there is no need to duplicate the left one. Also we don’t need vertical grid lines. Let’s hide them right now.
| 1 2 | barChart.rightAxis.enabled = false barChart.xAxis.drawGridLinesEnabled = false |
Last, but not least. What about a nice animation making first impression even better? Animations often are a pain in the neck. But not with Charts! Add this line just after setting bar chart’s data.
| 1 | barChart.animate(yAxisDuration: 1.5, easingOption: .EaseInOutQuart) |
That’s all. Not so hard, huh? Take a look at the final effect we achieved here.

Of course that’s not everything that Charts lets you do. Check this library out with it’s numerous charts types and take a look at hundreds of properties that let you customize charts that you create.
Thank you for reading. Have a happy Easter and feel free to comment!
You can find complete source code on Droids on Roids’s GitHub repository.
About the author
Piotr Sochalewski
Ready to take your business to the next level with a digital product?
We'll be with you every step of the way, from idea to launch and beyond!

Ready to take your business to the next level with a digital product?
We'll be with you every step of the way, from idea to launch and beyond!


Thanx! The nice tutorial, I’m a new on Swift development, it helps me
Thanks for your tutorial. I tried it using Xcode Version 8.1 (8B62) and got the following compiler errors. Any suggestions?
https://uploads.disquscdn.com/images/3025cf1e0b588191572291d92fe715e663d65ae6b889d4bc5906dbdcc274d1f2.png
Hi Tony. The syntax has changed when Charts started using Swift 3.0. Now it looks like this:
ChartDataEntry(x:y:)Both API’s have changed. xVals is gone. How do you set X-labels now?
import Foundation
import Charts
public class LargeValueFormatter: NSObject, IValueFormatter, IAxisValueFormatter
{
private static let MAX_LENGTH = 5
/// Suffix to be appended after the values.
///
var tickArray: NSArray!
/// An appendix text to be added at the end of the formatted value.
public var appendix: String?
public override init()
{
}
public init(tickArray: NSArray){
self.tickArray = tickArray
}
public init(appendix: String?)
{
self.appendix = appendix
}
private func format(value: Double) -> String
{
var sig = value
var length = 0
let maxLength = suffix.count – 1
while sig >= 1000.0 && length String
{
return self.tickArray.object(at: Int(value)) as! String
// return months[Int(value)]
}
public func stringForValue(_ value: Double, entry: ChartDataEntry, dataSetIndex: Int, viewPortHandler: ViewPortHandler?) -> String
{
return format(value: value)
}
}
let formatter = LargeValueFormatter()
formatter.tickArray = self.graph.xAxisTickArray
let xAxis = XAxis()
xAxis.valueFormatter = formatter
self.barChartView.xAxis.valueFormatter = xAxis.valueFormatter
How do you set the salesMonths labels after Swift 3.0?
Can show an example of pie chart with swift 3 and charts 3.0.0
Hi,
Thanks for your tutorial.
But I am facing following problem, please help me. https://uploads.disquscdn.com/images/043a4c93f78f391cff6422c65abccba566194edc32b912392c51fc17ddea89b6.png
https://uploads.disquscdn.com/images/0129a43f8a7484cfa7f3522bc8197618657b588bb246e22b7039994d9c530454.png Hi,
I am getting bar width only 1 pixel. How can I increase bar width ?
Have you figured it out?
I figured it out but now i just forgot what exactly I changed. My working code is below please go through it. It might help you.
func styleBarChart() {
barChartView.rightAxis.drawGridLinesEnabled = false;
barChartView.noDataText = “No data to show at the moment.”
barChartView.xAxis.labelRotationAngle = -70;
barChartView.xAxis.granularity = 1
barChartView.leftAxis.spaceBottom = 0.0;
barChartView.chartDescription?.enabled = false
barChartView.xAxis.gridColor = .lightGray;
barChartView.rightAxis.gridColor = .lightGray;
barChartView.leftAxis.gridColor = .lightGray;
barChartView.xAxis.gridLineWidth = 0.1;
barChartView.rightAxis.gridLineWidth = 0.1;
barChartView.leftAxis.gridLineWidth = 0.1;
barChartView.legend.enabled = false
barChartView.xAxis.labelPosition = .bottom;
}
func updateGraph(filterNum:Int) {
// this forces to display each value of datapoint in xAxis
self.barChartView.xAxis.setLabelCount(self.edh.epic.graphPoints.count, force: false);
barChartView.xAxis.valueFormatter = IndexAxisValueFormatter(values:self.edh.epic.getXLabelValues());
// empty values are provided. its a trick to hide those long values in rightaxis and leftaxis
// barChartView.leftAxis.valueFormatter = IndexAxisValueFormatter(values: []);
barChartView.rightAxis.valueFormatter = IndexAxisValueFormatter(values: []);
let chartDataSet = BarChartDataSet(values: self.edh.epic.getDataEntries(filterNum: filterNum), label: “”)
chartDataSet.colors = [Constants.Color.colorGraph1,Constants.Color.colorGraph2,Constants.Color.colorGraph3,Constants.Color.colorGraph4,Constants.Color.colorGraph5];
let chartData = BarChartData(dataSet: chartDataSet)
// bar will occupy leaving no extra space.Value provide in percentage
// barChartView.xAxis.labelTextColor = .red;
barChartView.xAxis.labelFont = NSUIFont.systemFont(ofSize: 11.0);
// barChartView.xAxis.centerAxisLabelsEnabled = false;
barChartView.data = chartData
// this resets the animation zoom etc
// self.barChartView.fitScreen();
barChartView.animate(yAxisDuration: 0.75, easingOption: .easeInOutQuart)
}
Hello, I have the same problem, could you figure it out?
Thanks for the awesome write-up, Piotr! Thinking about using Charts (and MPAndroidChart) for an app, and it would be great to see apps that are using one or both of the APIs/libraries. What apps, iOS or Android, use Charts or MPAndroidChart for their graphs, and which of those have you been most impressed by?